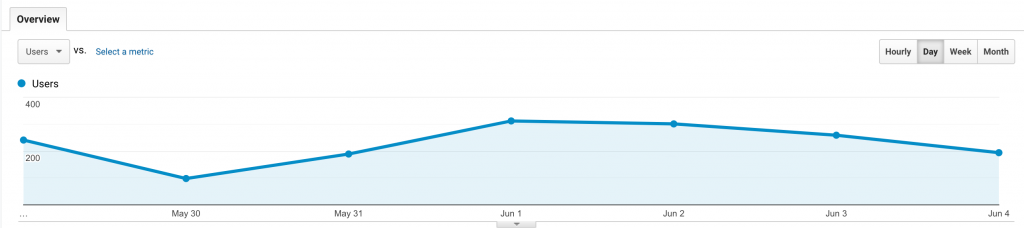
Date Range: May 29 – June 4, 2020
Audience Overview:
-
-
- Visitors: 1,092 (change from previous week: -13%)
- Number of Sessions/User: 1.82 (change from previous week: -3.7%)
- Pageviews: 11,267 (change from previous week: -13%)
- Pages/Session: 5.68 (change from previous week: +4.4%)
- Avg Session Duration: 8:32 (change from previous week: +3.6%)
- Bounce Rate: 22.04 % (change from previous week: -7.4%)
-
Demographics:
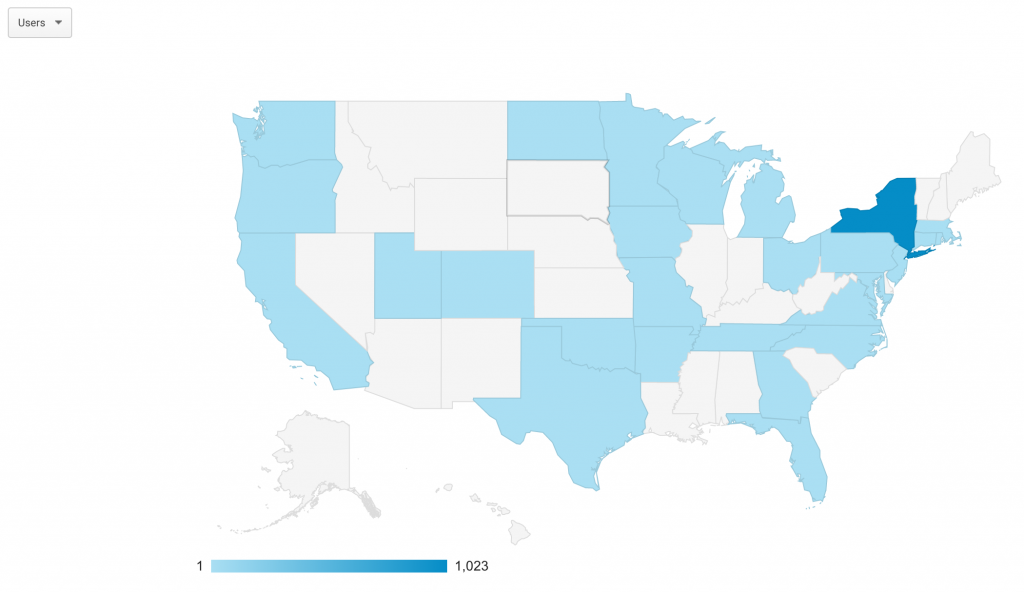
United States
-
-
-
- U.S. based visitors – 99%
- New York State visitors – 94%
- Other notable states – MA, CA, CT, NJ, WA
-
-
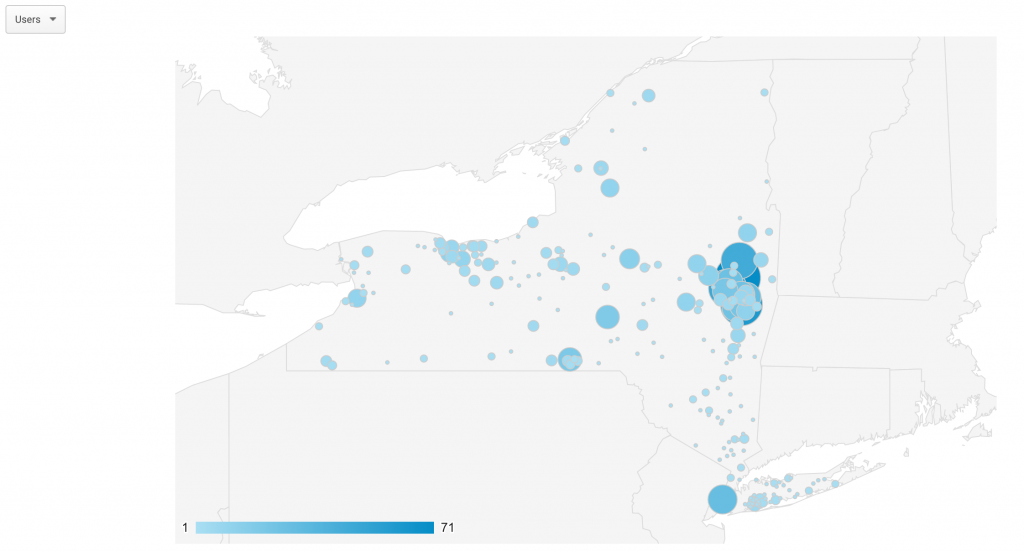
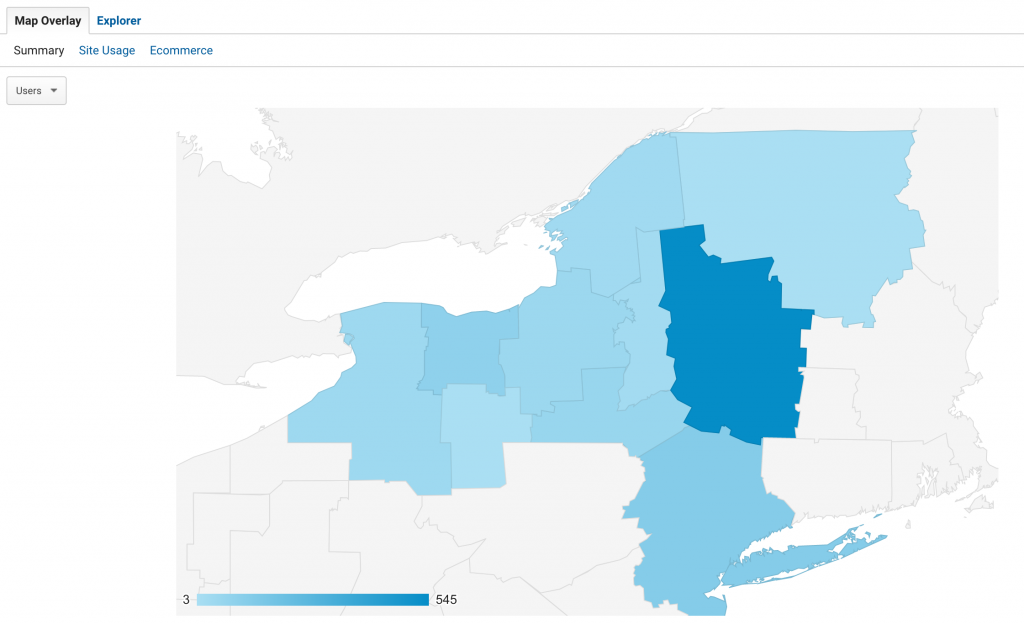
New York Regions
-
-
-
- Capital Region – 53%
- NYC/LI – 12%
- Rochester – 9%
- Binghamton – 6%
- Syracuse – 5%
- Unknown – 5%
- Buffalo – 4%
- Watertown – 3%
- Utica – 2.5%
- Elmira – <1%
-
-
Desktop vs. Mobile:
-
- Desktop – 89.5%
- Mobile – 9%
- Tablets – 2%
Browsers:
-
- Chrome – 81%
- Safari – 12%
- MS Edge – 3.5 %
- Firefox – 2%
Traffic:
-
- Direct – 68.5%
- Search – 19%
- Referral – 12%
Top Pages:
-
- Grades K-5 – 1,633 pageviews (14%)
- Home – 1,135 pageviews (10%)
- Grades K-5/grade-3-math/grade-3-math-unit-5-and-6/ – 407 pageviews ( 3.5%)
- Grades K-5/kindergarten-ela/kindergarten-ela-unit-5/ – 401 pageviews (3.5%)
- Grades K-5/grade-2-math/grade-2-math-units-5-and-6/ – 316 pageviews (3%)