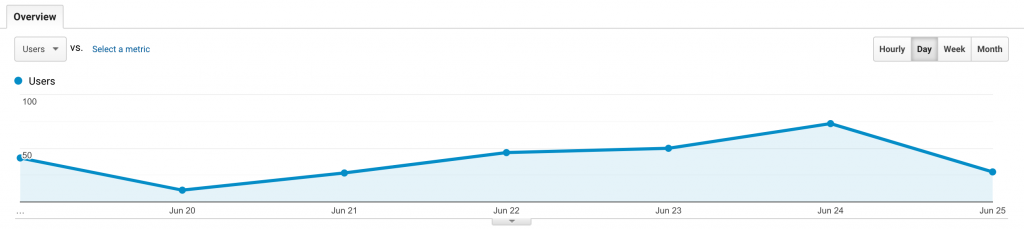
Date Range: June 19 – 25, 2020
Audience Overview:
-
-
- Visitors: 252 (change from previous week: -39%)
- Number of Sessions/User: 1.21 (change from previous week: -13%)
- Pageviews: 1,022 (change from previous week: -59%)
- Pages/Session: 3.35 (change from previous week: -22%)
- Avg Session Duration: 2.41 (change from previous week: -41%)
- Bounce Rate: 47.87 % (change from previous week: +23%)
-
Demographics:
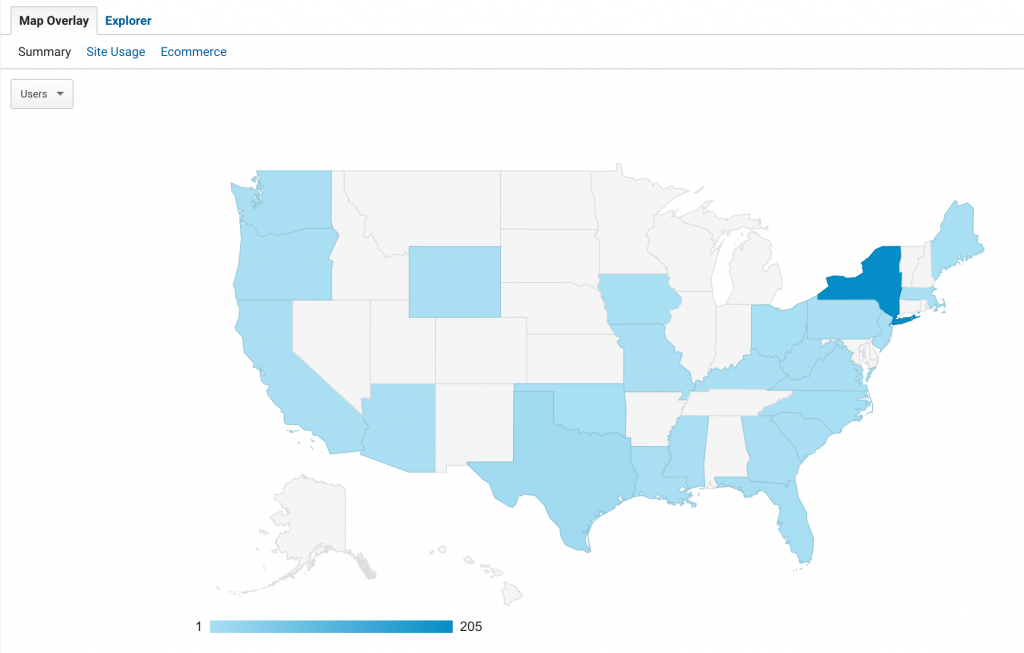
United States
-
-
-
- U.S. based visitors – 97%
- New York State visitors – 83%
- Other notable states – TX, FL, IA, MA, ME
-
-
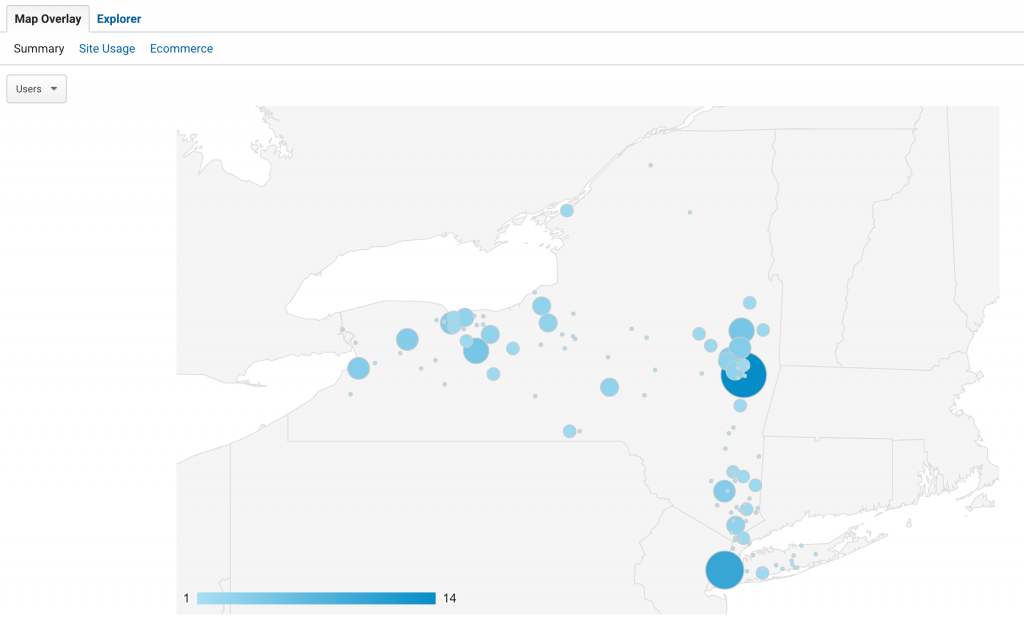
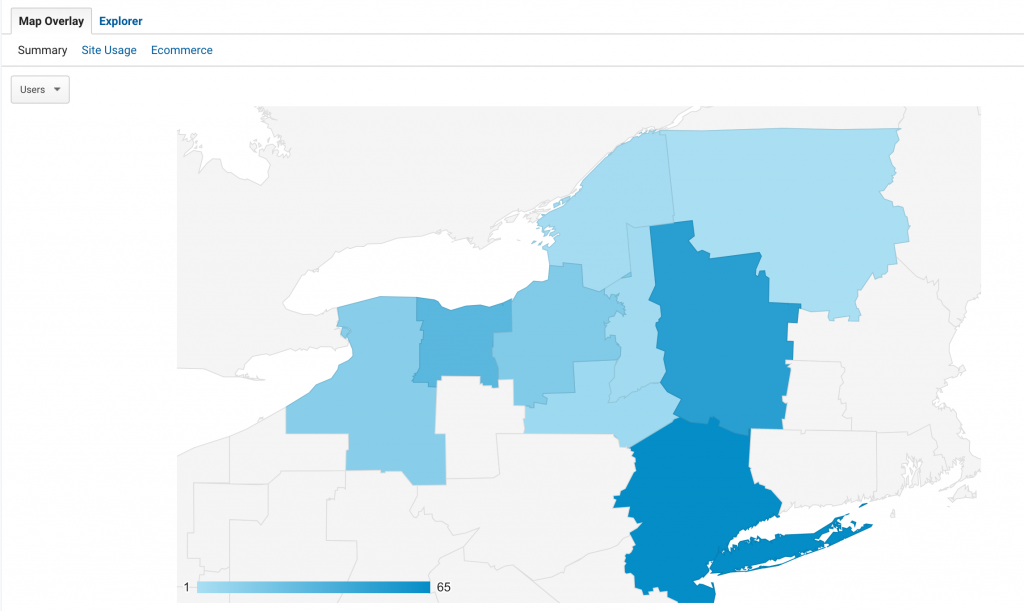
New York Regions
-
-
-
- NYC/LI – 31%
- Capital Region – 24%
- Rochester – 15%
- Syracuse – 8%
- Unknown – 7%
- Buffalo – 7%
- Binghamton – 3%
- Utica – 2%
- Watertown – 2%
-
-
Desktop vs. Mobile:
-
- Desktop – 86%
- Mobile – 13%
- Tablets – 1%
Browsers:
-
- Chrome – 76%
- Safari – 12%
- MS Edge – 7 %
- Firefox – 3%
Traffic:
-
- Direct – 57%
- Search – 23%
- Referral – 20%
Top Pages:
-
- Home – 205 pageviews (19.38%)
- /grades-k-5/ – 163 pageviews pageviews (15.41%)
- /grades-6-8/ – 45 pageviews (4.25%)
- /grades-9-12/ – 43 pageviews (4.06%)
- /modifying-units/planning-remote-instruction/ – 37 pageviews (3.50%)